The FacileData package was written to facilitate easier analysis of large, multi-assay high-throughput genomics datasets. To this end, the FacileData package provides two things:
- A FacileData Access API that defines a fluent interface over multi-assay genomics datasets that fits into the tidyverse. This enables analysts to more naturally query and retrieve data for general exploratory data analysis; and
- A reference implementation of a datastore that implements the FacileData Access API called a FacileDataSet. The
FacileDataSetprovides efficient storage and retrieval of arbitrarily large high-throughput genomics datasets. For example, a singleFacileDataSetcan be used to store all of the RNA-seq, microarray, RPPA, etc. data from the The Cancer Genome Atlas. This singularFacileDataSetallows analysts easy access to arbitrary subsets of these data without having to load all of it into memory.
Installation
The FacileData suite of packages is only available from github from now. You will want to install three FacileData* packages to appreciate the its utility:
# install.packages("devtools")
devtools::install_github("facilebio/FacileData")
Example Usage
As a teaser, we’ll show how to plot HER2 copy number vs expression across the TCGA bladder and breast indications (“BLCA” and “BRCA”) using a FacileDataSet.
library(ggplot2)
library(FacileData)
library(FacileTCGADataSet)
tcga <- FacileTCGADataSet()

features <- filter_features(tcga, name == "ERBB2")

fdat <- tcga %>%
  filter_samples(indication %in% c("BLCA", "BRCA")) %>%
  with_assay_data(features, assay_name = "rnaseq", normalized = TRUE) %>%
  with_assay_data(features, assay_name = "cnv_score") %>%
  with_sample_covariates(c("indication", "sex"))

ggplot(fdat, aes(cnv_score_ERBB2, ERBB2, color = sex)) +
  geom_point() +
  facet_wrap(~ indication)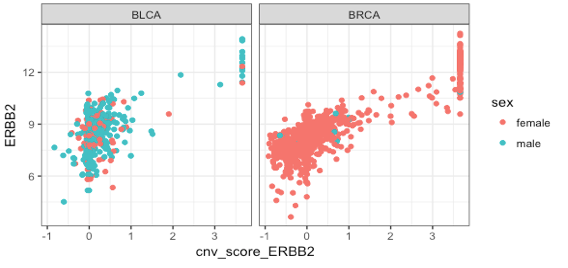
Let’s compare how you might do the same using data stored in a SummarizedExperiment named se.tcga that stores RNA-seq (raw and normalized) and copy number data.
# load / get `se.all` from somewhere
fidx <- which(mcols(se.all)$name == "ERBB2")
se <- se.all[, se.all$indication %in% c("BLCA", "BRCA")]

sdat <- data.frame(
  ERBB2 = assay(se, "rnaseq_norm")[fidx,],
  cnv_score_ERBB2 = assay(se, "cnv_score")[fidx,],
  sex = se$sex,
  indication = se$indication)

ggplot(fdat, aes(cnv_score_ERBB2, ERBB2, color=sex)) +
  geom_point() +
  facet_wrap(~ indication)
TODO: Show same analysis using MultiAssayEperiment
